Reportal is a web-based Monitoring and Evaluation System that is the culmination of our work on numerous M&E projects in the public sector over the past 15+ years.
Whereas other M&E systems have a fairly rigid specification that you purchase and have to adapt to, with Reportal we take the core M&E functionality and then completely adapt it to fit your requirements, including designing and building completely new functionality that fits exactly with your needs. It is worth emphasizing this point: we will be building on Reportal’s core functionality to deliver a solution that is developed to suit your specific requirements. Using this ‘core’ functionality as a basis lets us deliver highly customised, flexible solutions at an unusually affordable price.
To explain this in more detail, we will first describe the core M&E functionality in Reportal, and then give examples of how it can and has been adapted to suit other clients’ requirements.
Basic M&E Concepts
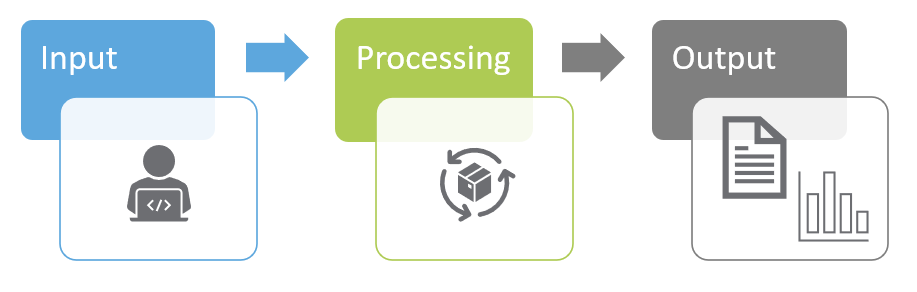
Like any basic M&E system, Reportal captures inputs, runs some processing, and generates outputs.
We call the input side: Data Elements. The Element is the definition of what we want to capture, and the Data is what gets captured. However, this data can vary according to the Date and the Entity it is being captured for. We can therefore represent these four items as a ‘star-schema’, as shown below:
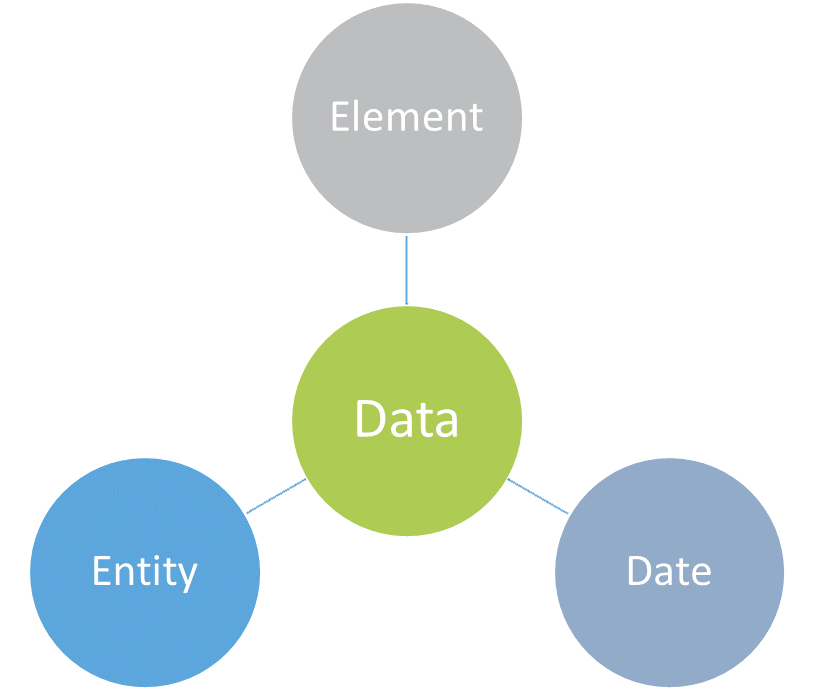
Each branch, or dimension, has additional properties:
- Elements: Elements are grouped together into subcategories and categories; for example, all water-related elements can exist in a Water & Sanitation category, with potentially a Testing and Quality subcategory. Elements also store configuration data, such as how frequently the data should be collected, which entity type it gets collected for, and how to aggregate the data (explanation to follow).
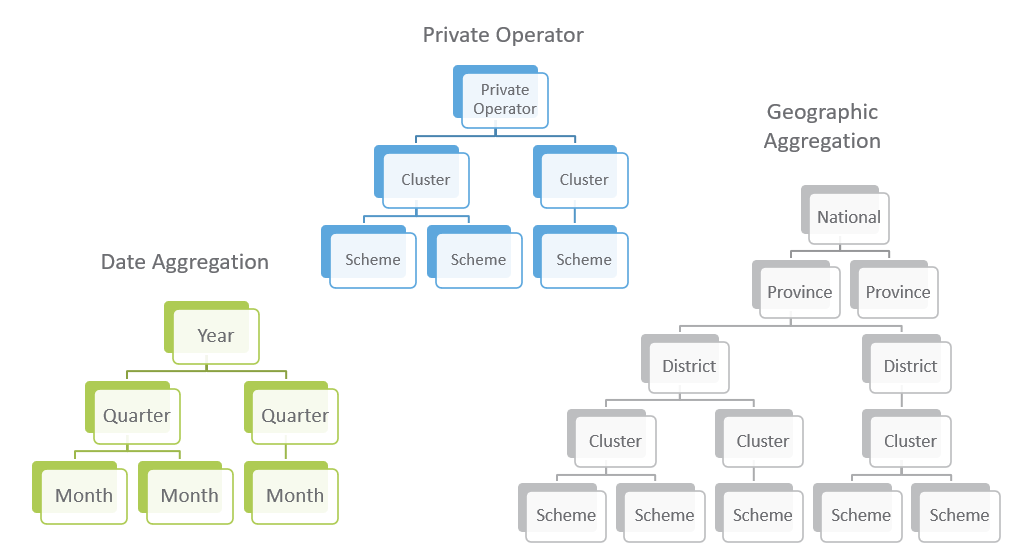
- Dates: Dates are naturally hierarchical, such as months falling into quarters and years. Dates have additional settings such as when they are open (for data collection).
- Entities: Firstly, entities have a type, which is completely flexible. You might have entity types such as Municipality, District, Province as well as Department, Organisation, etc. Hierarchical relationships between entities are easily configured in Reportal by an administrator; for example, Nkomazi Municipality is within the Ehlanzeni District in Mpumalanga.
Data elements are processed into values for Indicators – this will be explained in more detail shortly. In Reportal, we refer to the indicator values as facts, to distinguish them from element’s values or data. Facts and dimensions are terms frequently used in the data warehousing domain.
Aggregation
The first part of the processing is aggregation.
Data is collected at the entity type and date level configured on each element. For example, one element might collect data at a municipal level every month, whereas another element might collect data for districts every quarter.
The collected data then needs to be aggregated up the date and entity hierarchies. For example, to get a total population for a district, Reportal adds up the population values for each municipality in that district.
On the date dimension, Reportal offers two aggregation types: Sum and Most Recent. To get a population figure for the year, you wouldn’t sum the values for each month; you’d take the most recent monthly value within that year (if you were collecting population values monthly!).
As entities can have multiple hierarchies, the aggregation will apply along each ‘branch’. The image below illustrates the hierarchies configured in the RURA implementation.
Calculation
The next part of the processing is calculation, which converts the data elements into indicators, using a formula.
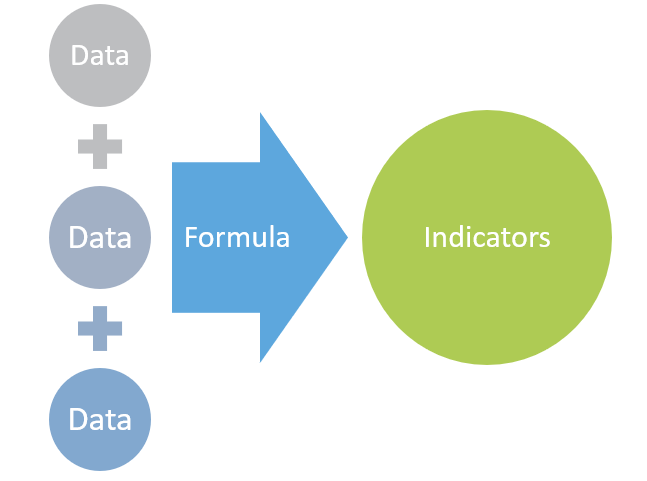
Administrators configure the formula through their admin logins. The screenshot below, from the RURA implementation of Reportal, shows an indicator Coverage Percent, which is the percentage of the population in the given area served by the water service provider. The formula is simply:
Coverage Percent = Number of total population served ÷ Number of population in the service area
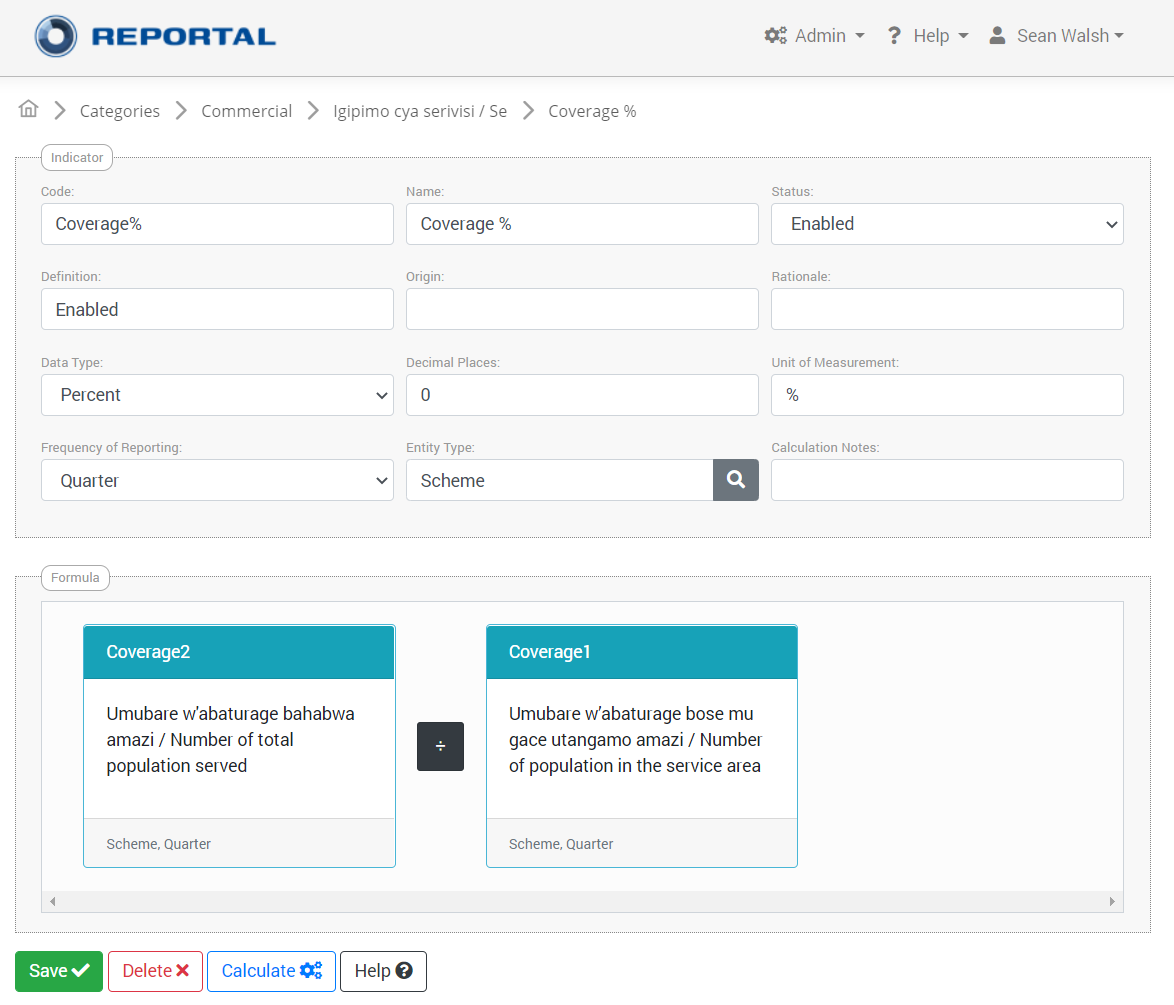
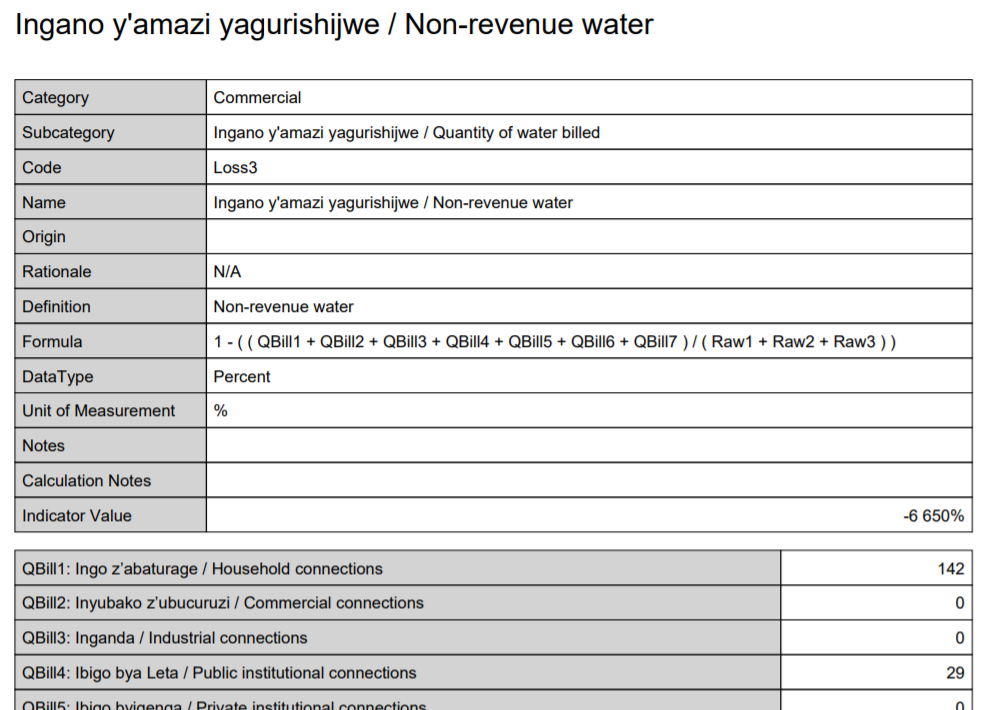
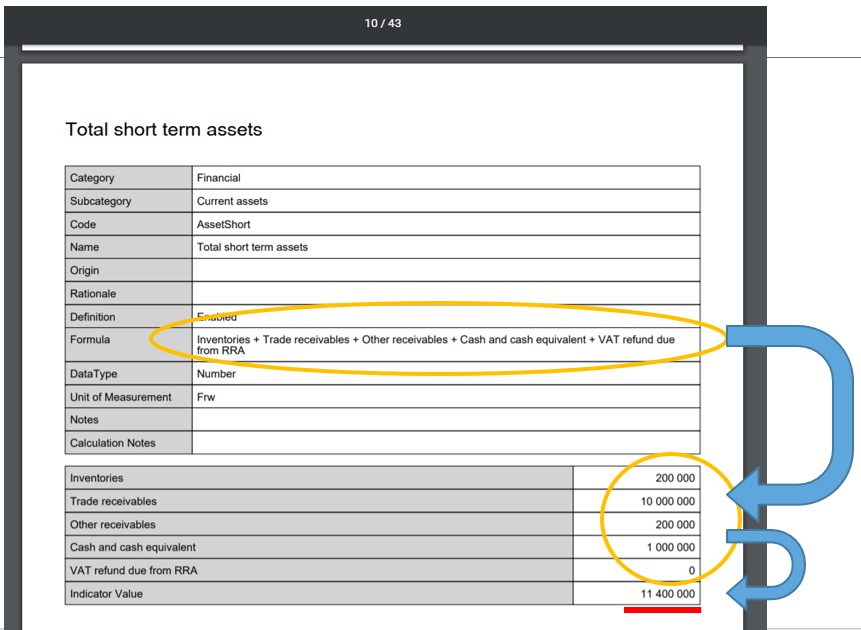
While this is a simple example, more complex formulae can easily be configured using the above webpage, such as the Non-Revenue Water example shown in a report format, below.
Indicators are calculated upwards from the specified reporting entity type and reporting frequency, i.e. if an indicator is defined at municipal level by quarter, it will also be calculated with the aggregated annual municipal values, as well as the quarterly and annual values for the associated district, province, etc.
Submitting and Approving Data
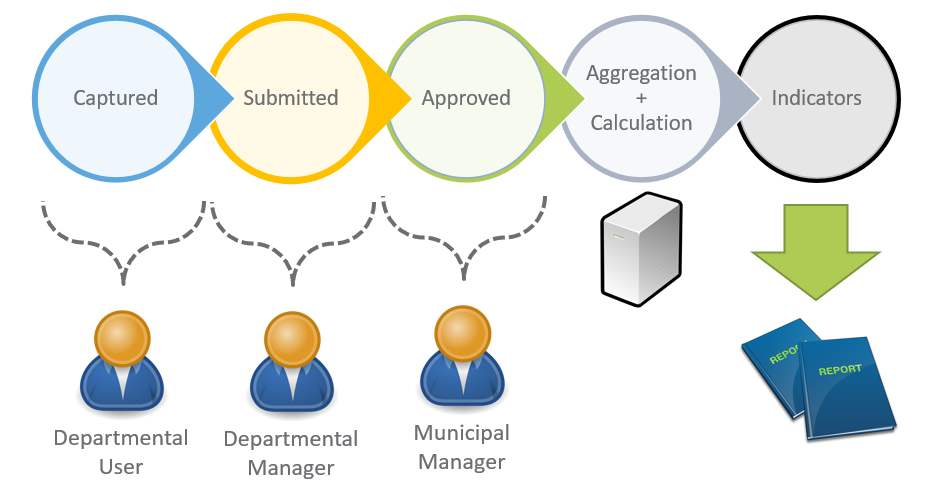
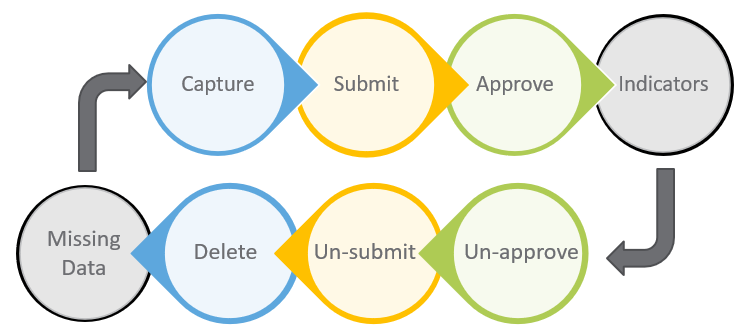
Each element in Reportal can be configured to require submission and/or approval. This allows you to have fine-grained control over what checks and balances are required before data can be considered ‘accepted’, as shown in the example diagram below.
The approval process can also be reversed should there be any issues with data that needs to be corrected – provided the user has the appropriate permission(s).
Element & Entity Permissions
In addition to the submit and approve permissions mentioned earlier, users can also be assigned permissions to entities, and can be granted view and edit permissions on elements.
The screenshot below shows the permission assignment screen for a user. The visible tab shows all the entity permissions that this user has been assigned.
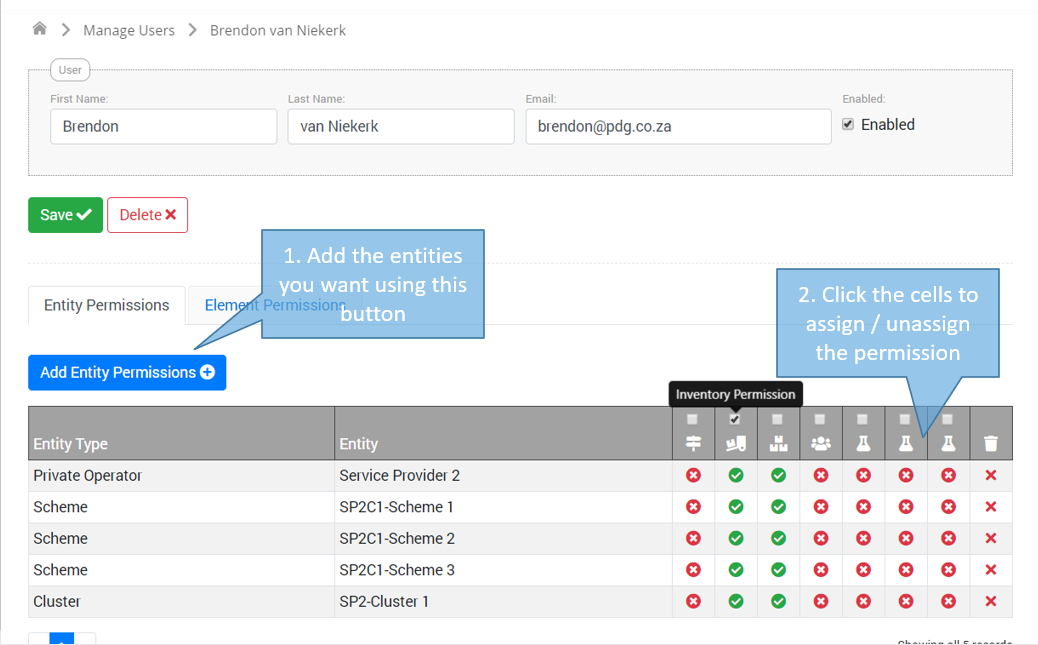
(In the above screenshot, the green circles are custom permissions for capturing additional schedules of information – a customization specific to the RURA deployment.)
Users can therefore be assigned to multiple entities, should this be your required configuration. In many cases, we find that some users are ‘oversight’ users, who have view-only access to a number of entities – i.e. all entities in a district, or a province, or all entities nationally for the top-level department/users.
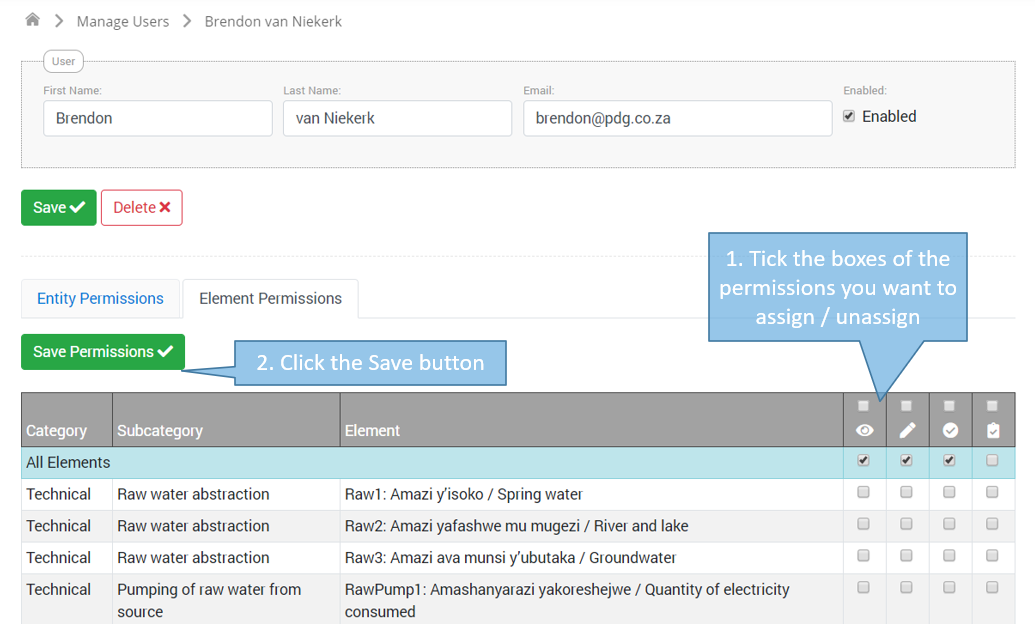
The screenshot below shows the element permissions that this user has been assigned. The columns on the right-hand side are for view, edit, submit, and approve – users can thus have different permissions per element. Note also that the top row is selected: this row is the All Elements row, which means the permissions checked apply to all elements in the system.
Organisations
Another concept in Reportal is organisations. Organisations are groupings of entities. As a slightly contrived example, you could create an organisation for a municipality, and then have entities for each municipal ‘department’ – water, electricity, community services, etc. (Note that this does not prevent you from creating municipalities as entities too.)
This allows for organisational (group-level) managers; these managers can assign permissions within their organisations. Thus, permission management can be devolved to the organisations, rather than centrally controlled. Managers can also perform the planning functions, i.e. setting baselines and targets for indicators for their entities.
Home Page
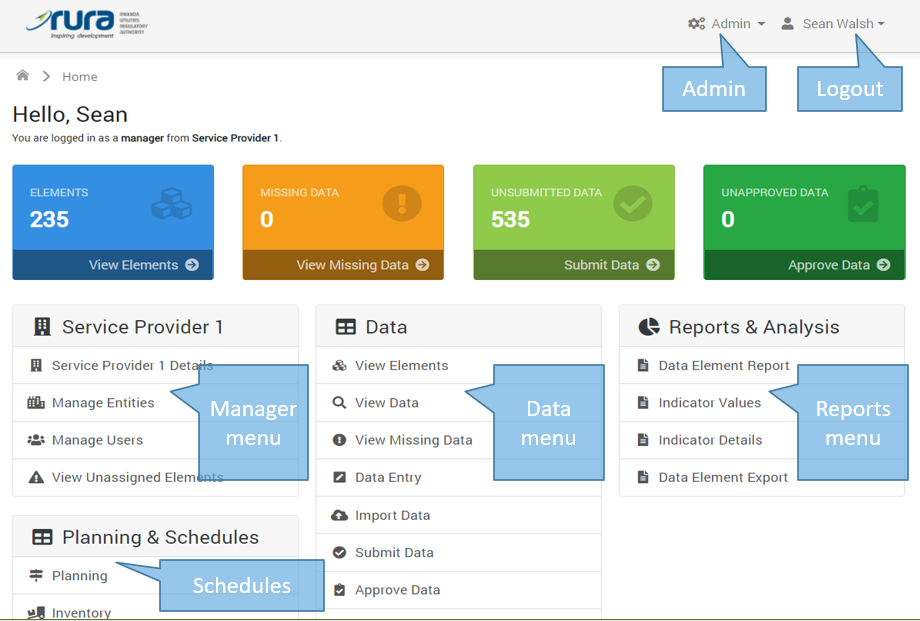
The home page is tailored to the permissions of the current user and can be further customised to the requirements of the specific implementation.
The screenshot below shows an example of the RURA home page, with various menus highlighted and the dashboard indications of the user’s data completion status.
Entering, Submitting and Approving Data
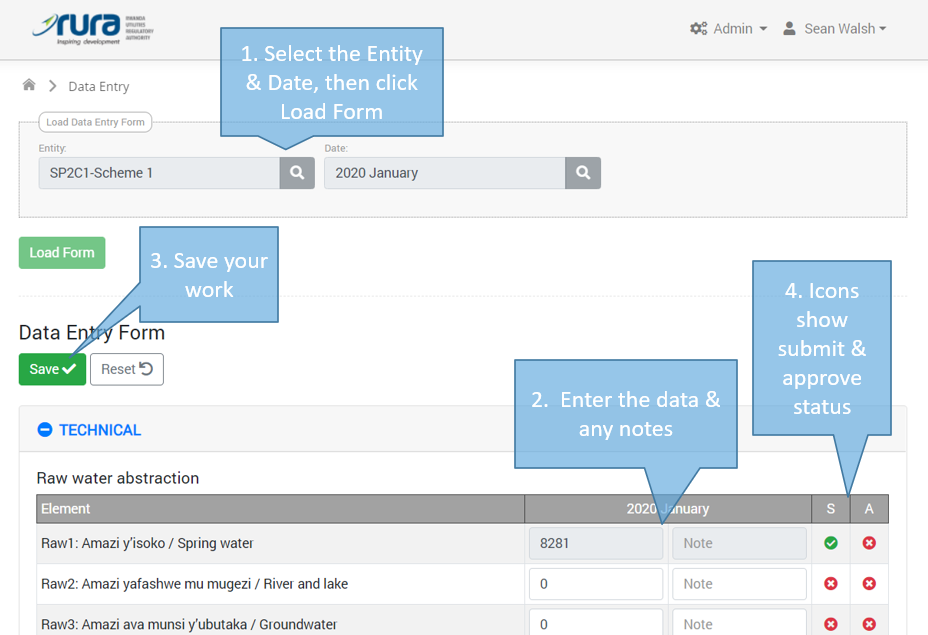
The screenshot below shows the basic data entry form for capturing data elements. The form has been loaded for a particular entity and date. The user will only be able to load the form for entities which he/she has permission. The form is then populated with tabular data entry sections for each element that the current user has permission.
As a demonstration of the mobile friendliness of the Reportal system, the image below shows the same page as viewed using an iPhone.
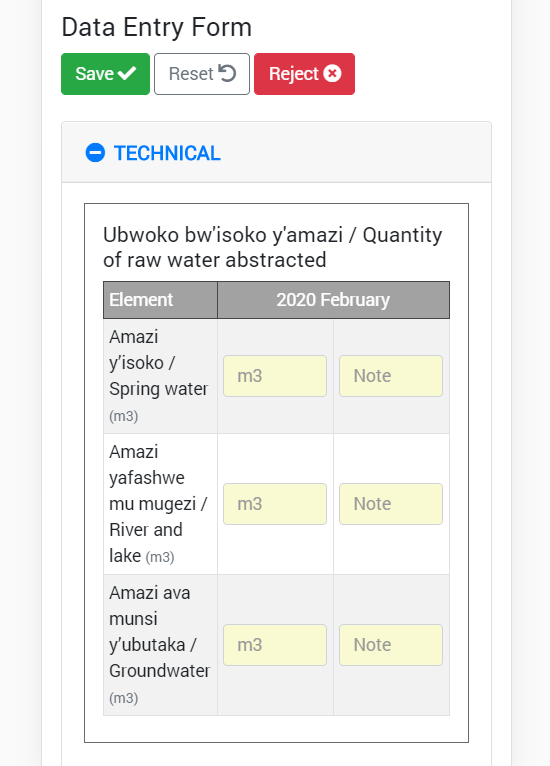
In general, Reportal is developed with desktop / laptop devices first-in-mind. However, all screens work on mobile devices, and if there are particular screens, such as the data entry screen, that are identified specifically as needing to be mobile friendly, we can make adjustments to the ensure that they work and display appropriately on any modern mobile device, including both iOS and Android smartphones.
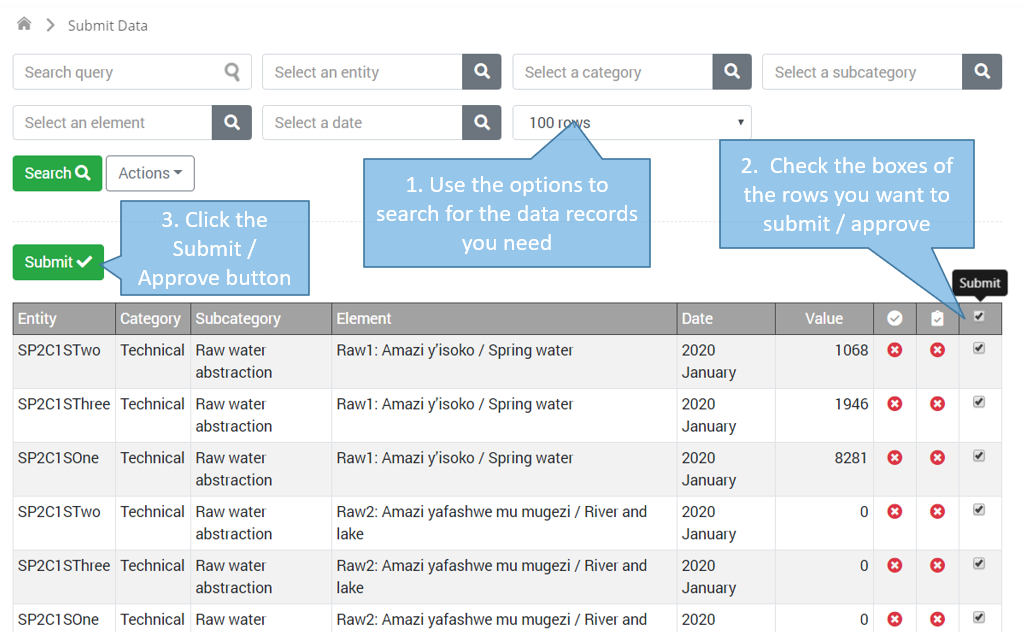
Submitting and approving data has a separate screen, which allows a user to bulk submit or approve data across entities and dates, as shown below.
Reminders & Assistance for Data Completion
Reportal assists and encourages that completion and submission of data using a number of screens and emails.
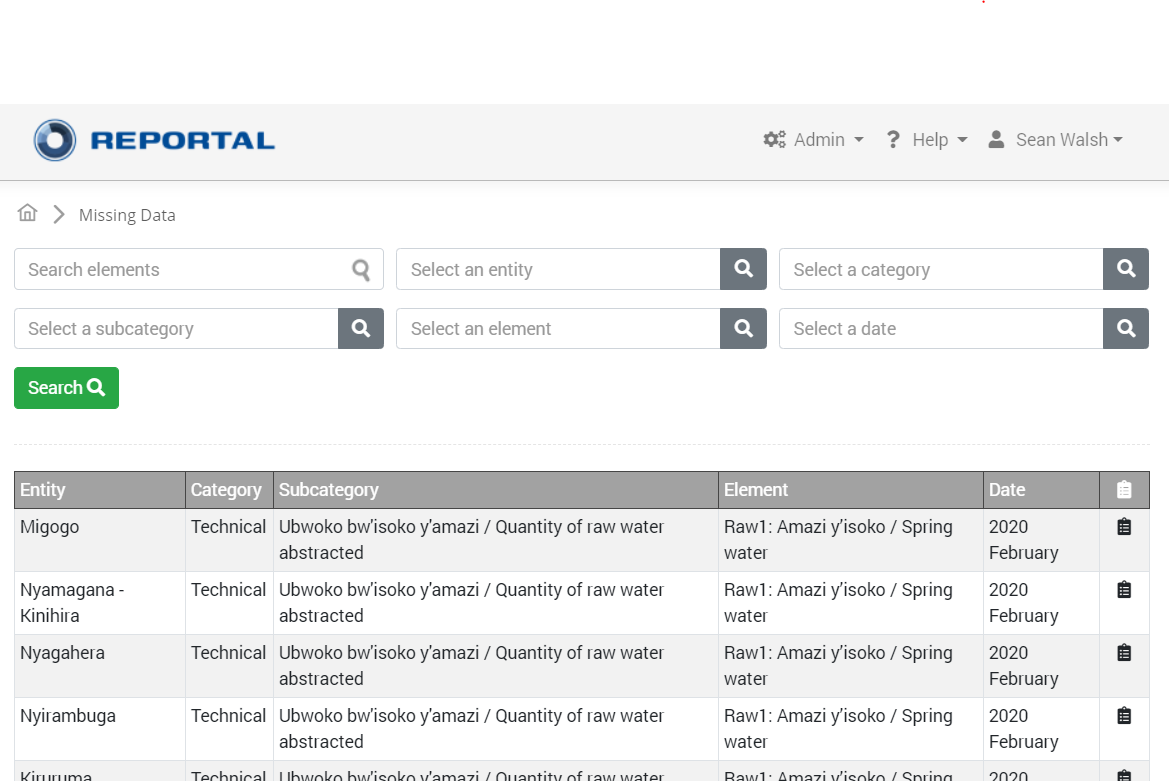
The missing data screen, shown below, lets the user view all data elements which he/she has not captured or submitted or approved.
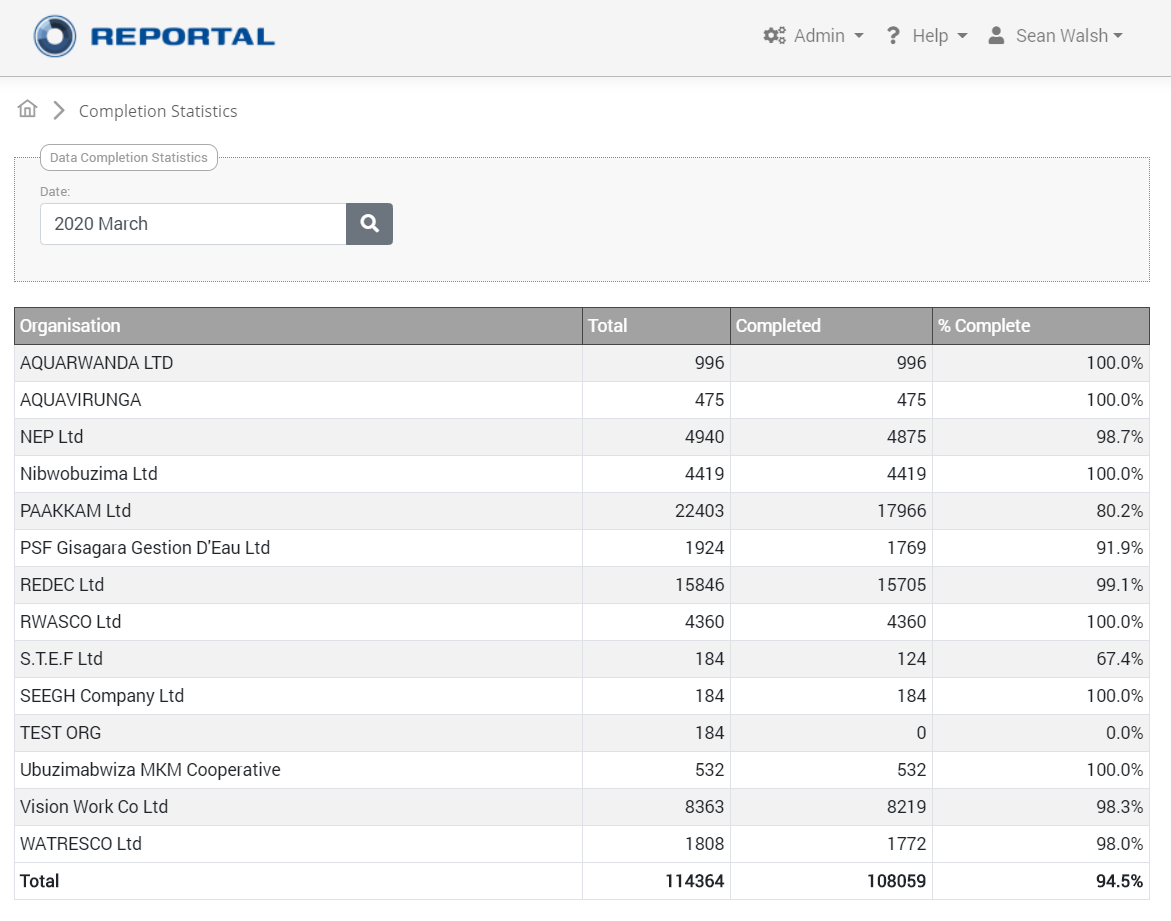
Overall completion statistics are presented by organisation as shown below; each row can be clicked on to ‘drill down’ into more detail.
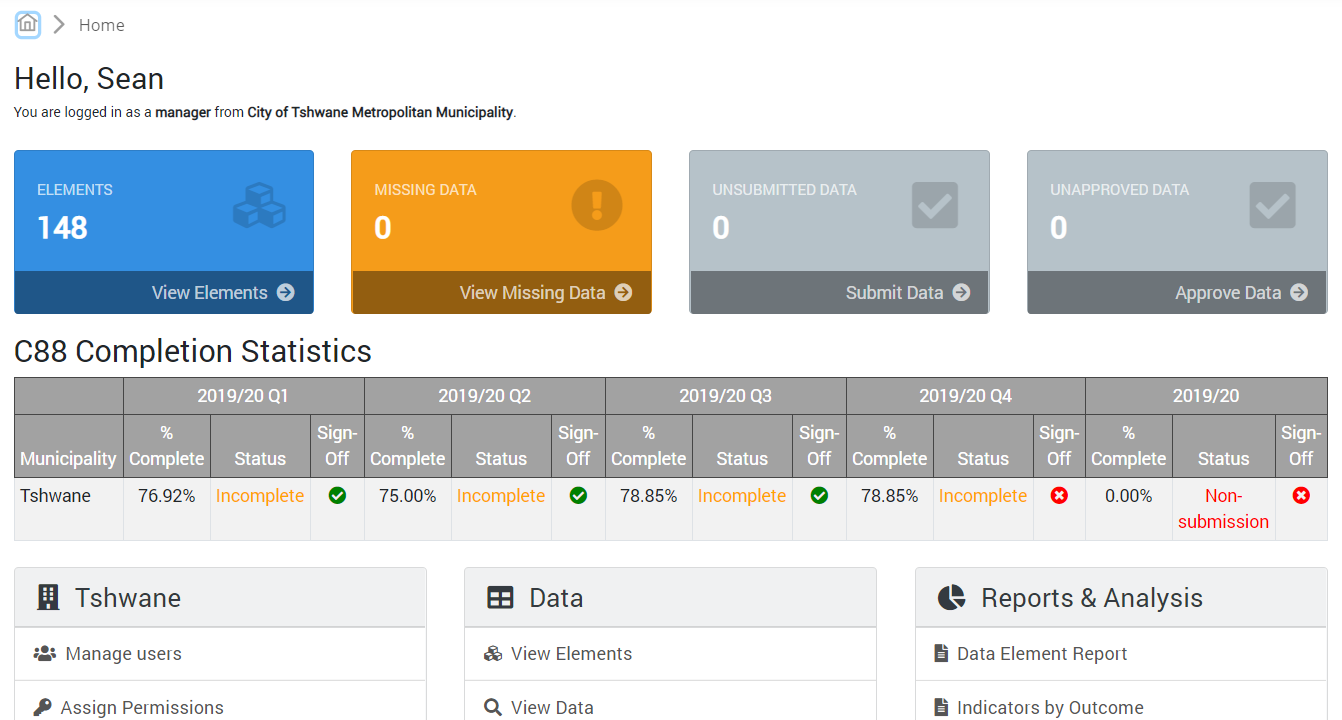
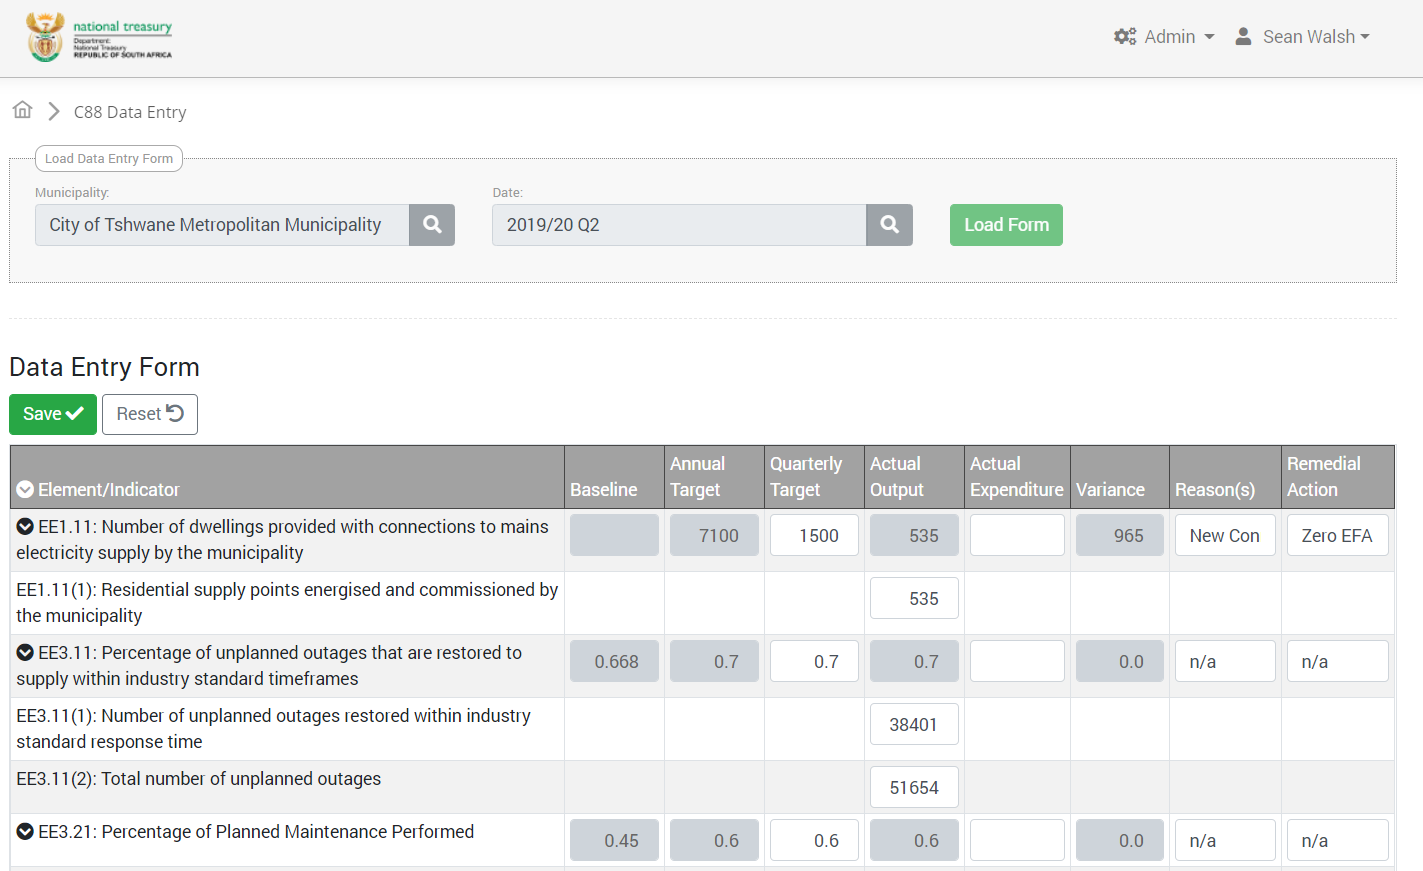
In a deployment for National Treasury, the home page was customised to show completion statistics for the Circular 88 data entry form, as shown below.
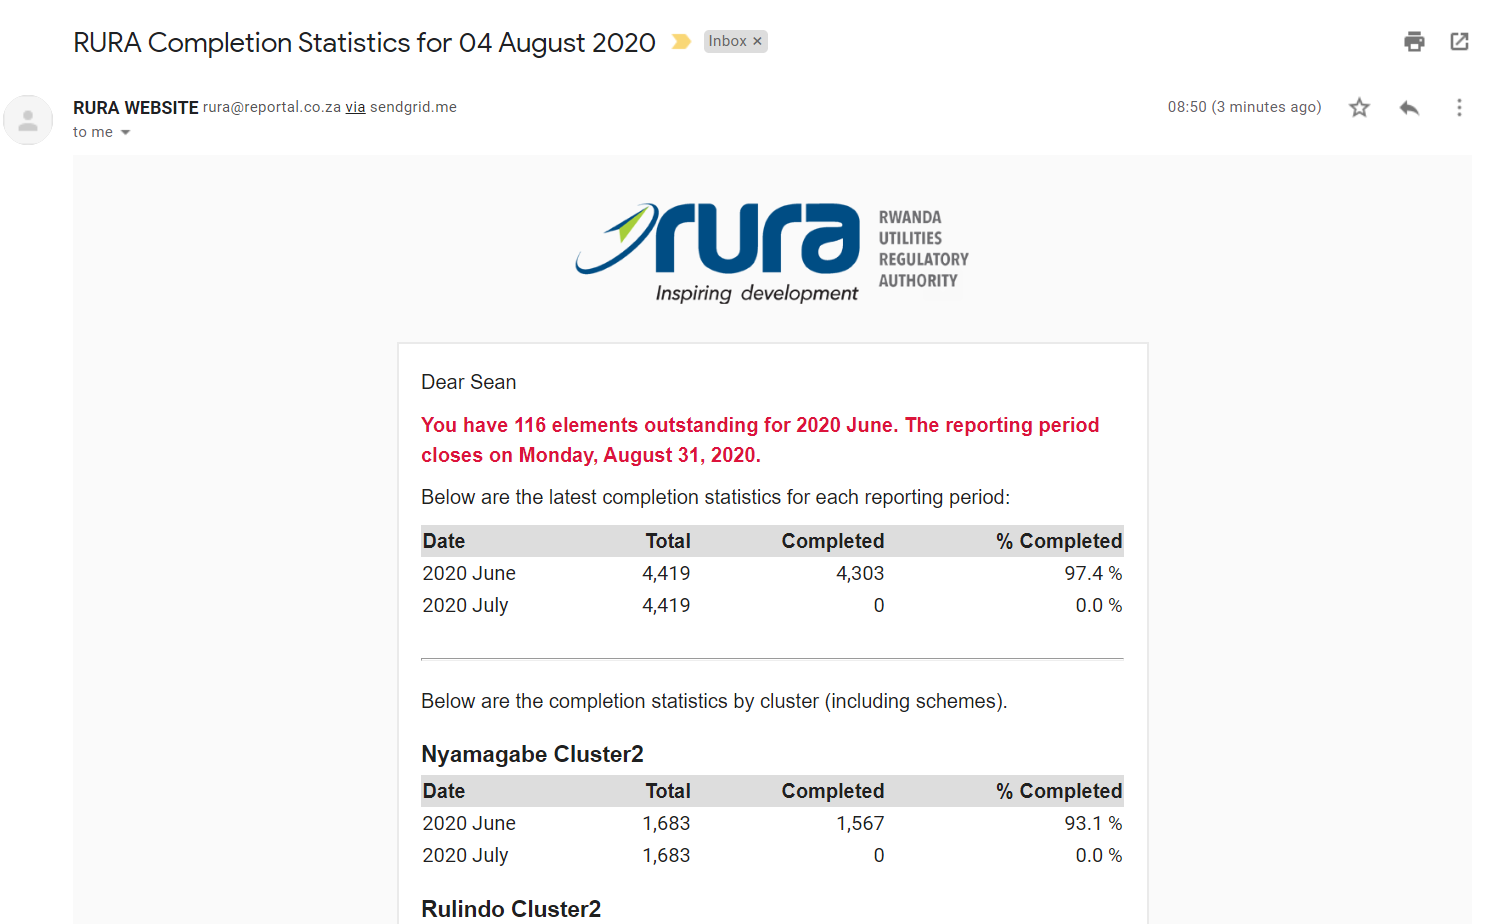
Automated emails can be scheduled to send reminders and completion statistics as shown below. Note how the email mentions the reporting period; this configuration lets Reportal when data elements are due so it can send these ‘upcoming reminder’ emails.
Automated emails can be scheduled to send reminders and completion statistics as shown below. Note how the email mentions the reporting period; this configuration lets Reportal when data elements are due so it can send these ‘upcoming reminder’ emails.
These reminders can be extended to include notifications, alerts and statistics for the submission and approval permissions.
An Unassigned Elements screen helps managers identify elements that have not been assigned and can result in data gaps. This is particularly useful when a user account is disabled, and someone needs to be assigned the permissions that the previous user had.
Importing Data (Offline Data Completion)
Although Reportal makes data entry easy and convenient, available from any device with a browser and internet connection, there are times when it suits users to complete data entry in an offline environment, or in an Excel format. This data can then be easily imported into Reportal when the user is subsequently online. There are three options available for importing data:
- An Excel template can be generated by Reportal that is customised to the element permissions for the given user. The user can then complete the template offline and upload it into Reportal at a later date.
-
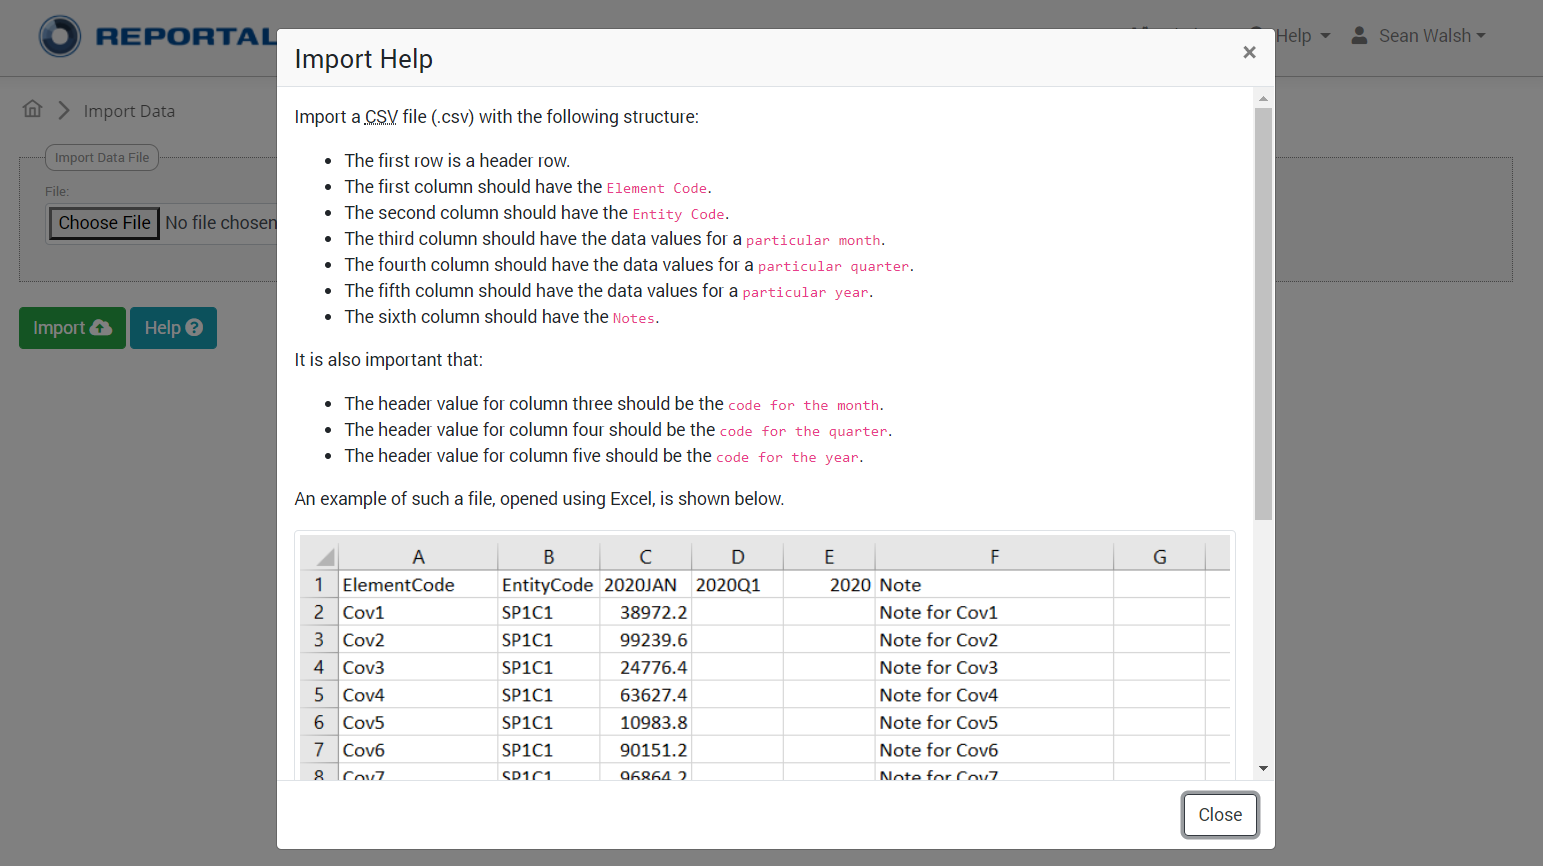
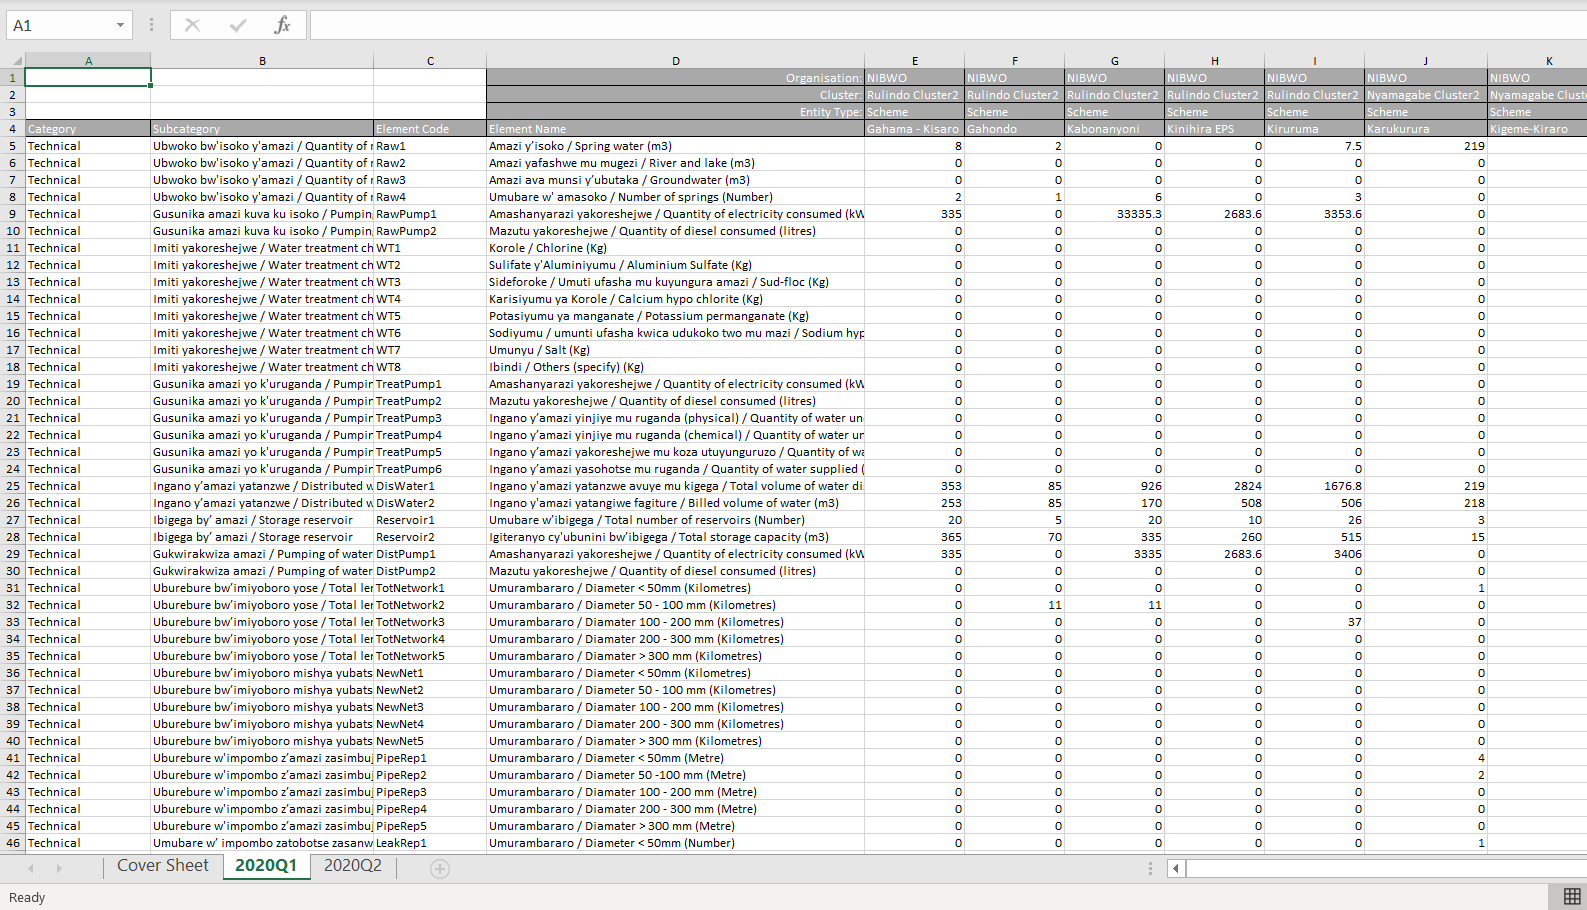
A Comma Separated Values file can be created using a template structure, which can be imported into Reportal. This option is useful for data interchange or integration between systems, where bulk data needs to be loaded into Reportal. An example of the structure is shown below.
-
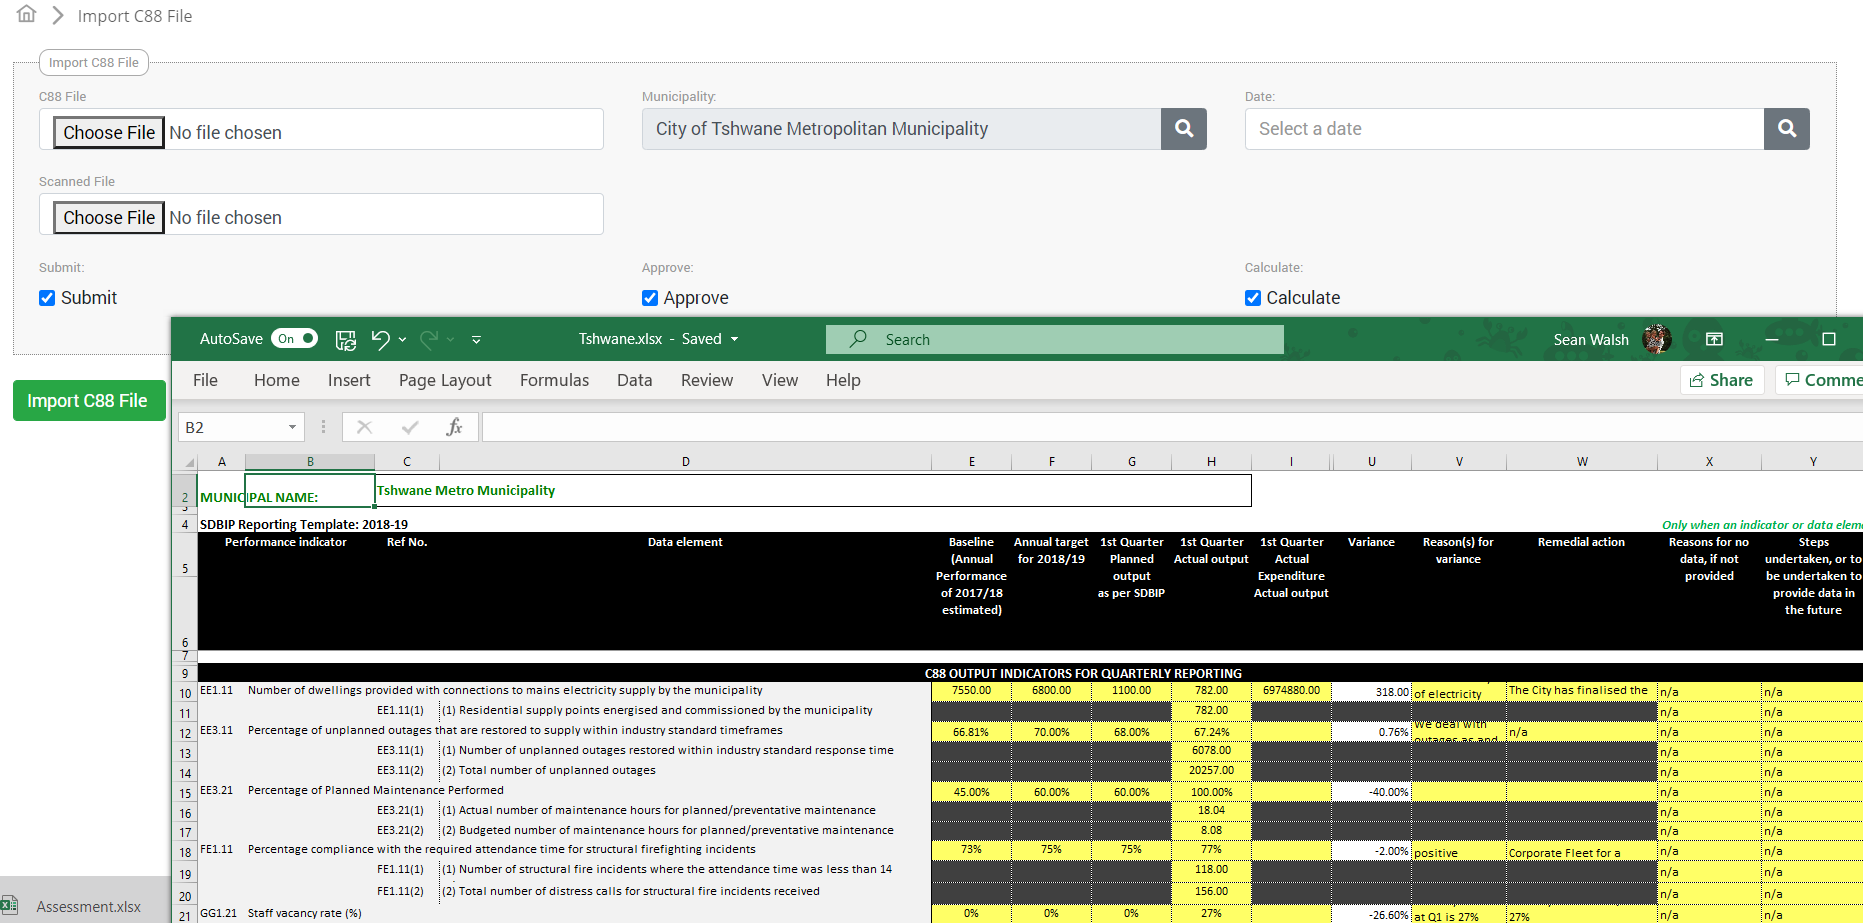
Custom file imports can be developed to handle specialised or customised file structures. The image below shows the relatively complex Circular 88 Excel file (complete with Excel validation, formatting, formulae, locked cells, etc.) that can be imported into the IBER version of Reportal:
In addition to having the above Excel export and import functionality, which facilitates offline data entry quite well, there is the possibility of developing an offline component of the website using the browser’s built-in storage capabilities – using a Progressive Web Application approach. We have used this approach before, in developing web-based questionnaires which are used in areas with little or no internet connectivity, but which can store the data and sync or upload the data, when a connection is available.
The implementation of Reportal for National Treasury was customised to require uploading the printed and signed C88 documents during the approval process. These documents are then stored on the system and can be retrieved when needed to verify the process was performed correctly.
Evidence can also be uploaded to support data entry completion. In the RURA implementation of Reportal, this was used extensively – additional ‘schedules’ for water testing results and bank balances were developed, and users were required to upload copies of the physical evidence when completing these data entry forms.
This aspect can be further developed into a broader document repository if required.
Audit Tracking
Reportal keeps track of which user last modified the data records, as well as the date on which it was done. This also applies to the submission and approval of data elements.
Baselines & Targets (Planning)
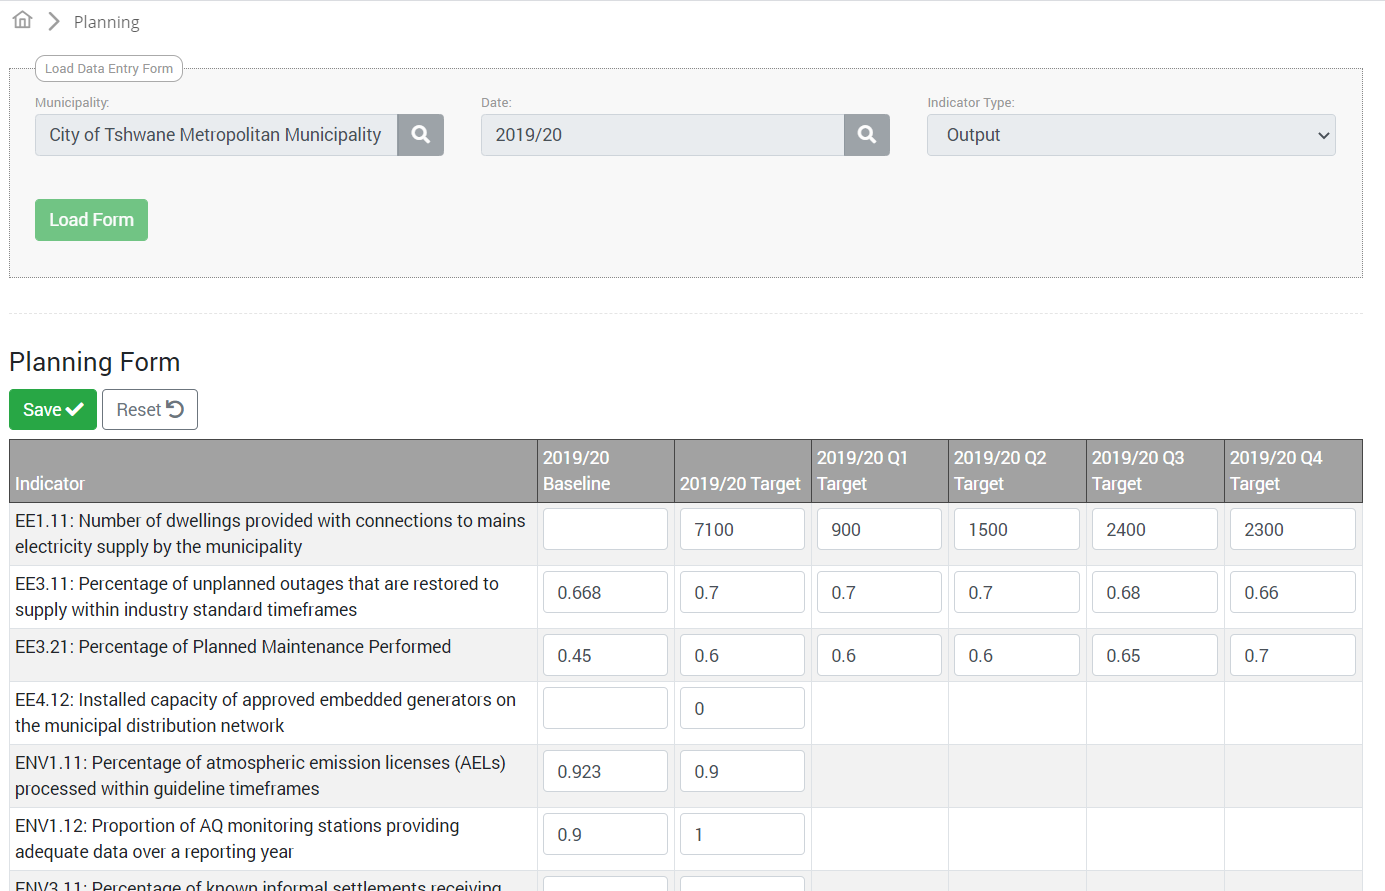
Managers use the planning page to set the baselines and targets for each indicator. The structure of the planning form will vary according to the indicator type (Output, Outcome, etc.).
Reporting Outputs
Reportal offers a number of standard reporting options. The most used reports tend to be the Data Element Report and the Indicator Reports.
The Data Element Report lets the user select one or more entities, and one or more dates. It can then output the results as either an Excel or a PDF file.
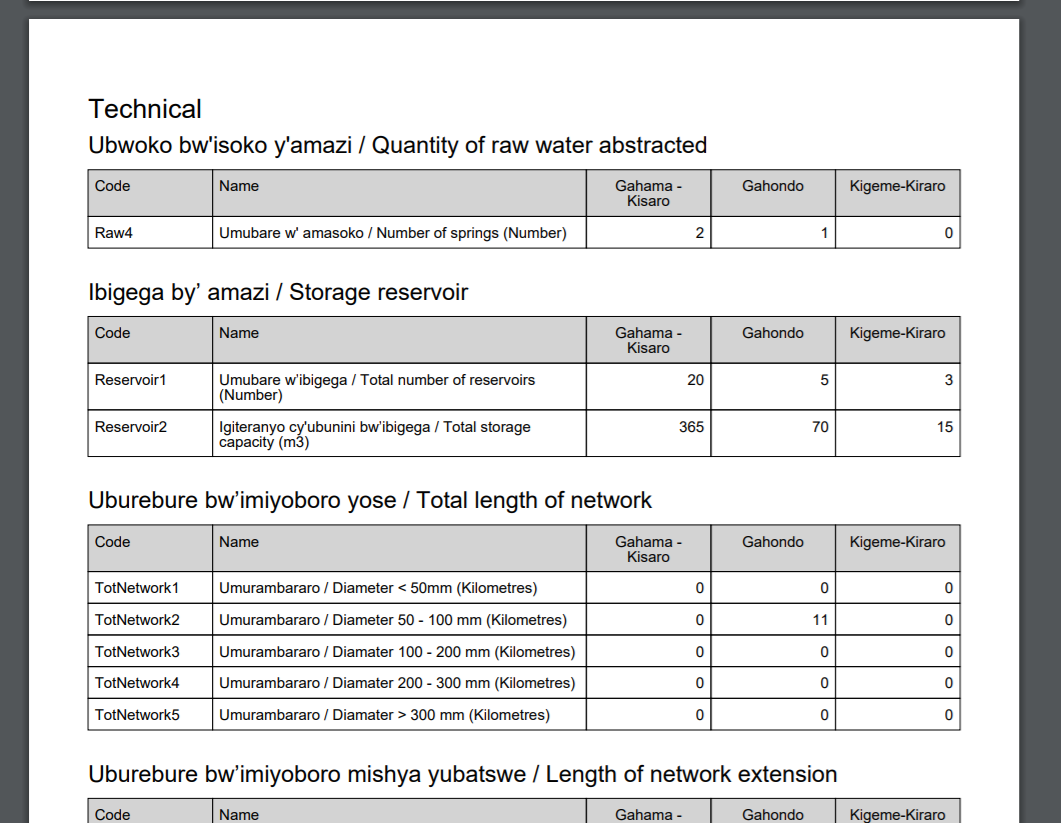
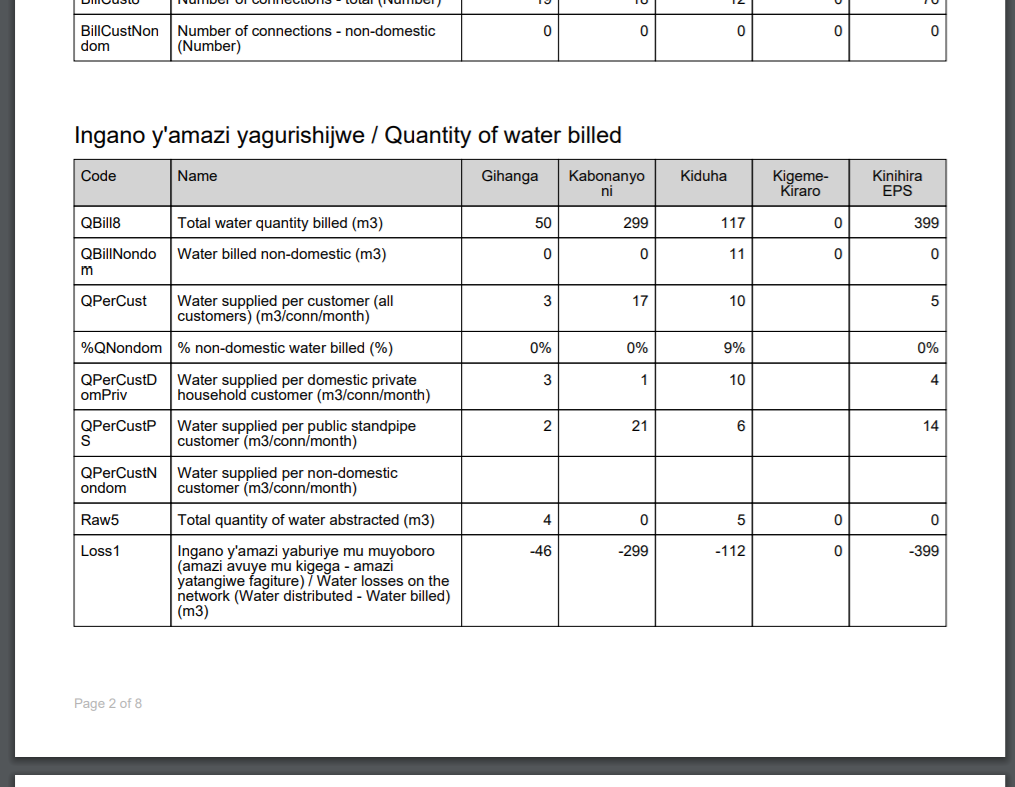
The screenshot below shows the PDF version for three entities. Elements are grouped by category and subcategory.
Using the Excel output format, more entities and dates can be selected. The results can then be grouped into worksheets either by date or by entity. The screenshot below shows a number of entities with worksheets for two of the quarters.
The Indicator Details report produces a detailed report for a particular entity. This report includes the formula and the data elements, which allows the user to easily see how the indicator result was calculated.
The Indicator Values Report is similar to the Data Element Report, allowing you to select multiple entities or dates, and view the results in either Excel of PDF. An example of the this report for five entities in PDF format is shown below.
These are only three examples of the reports available in Reportal. There is also the ability to bulk-export data to Excel, for both indicators and elements, and the option to develop custom reports to suit your requirements.
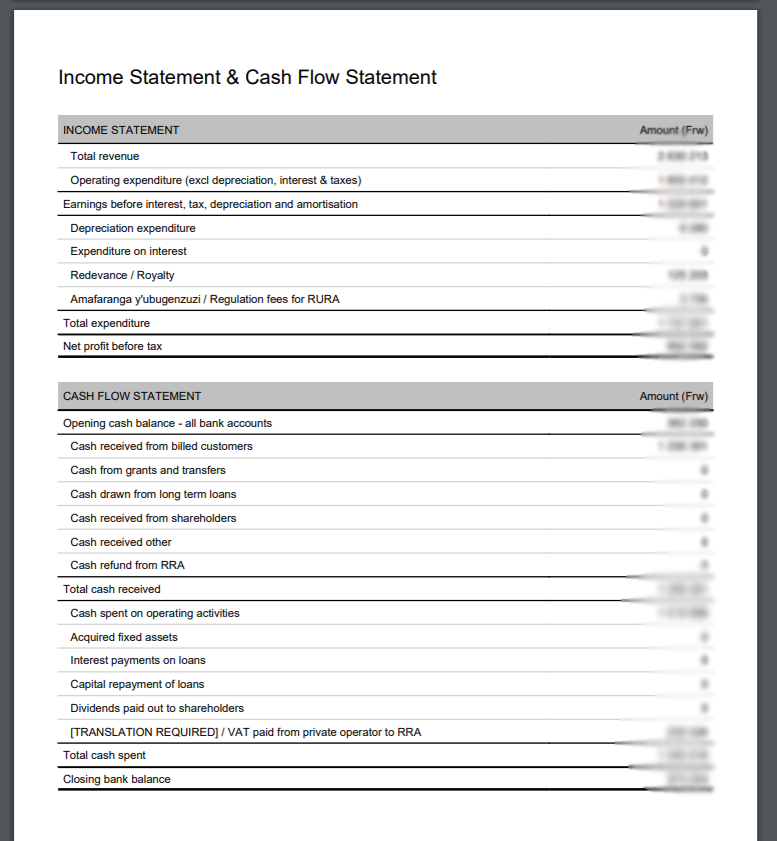
As an example: in the RURA implementation, some of the data elements defined were financial figures, which allowed us to develop a report for the financial statements (income statement, cash flow and balance sheet). This data is collected for each ‘cluster’ (a group of water service schemes) and could then be centrally monitored by RURA. The image below shows part of the custom report.
Visual outputs include the ability to view interactive charts of indicator and element values in the browser, such as the example shown below.
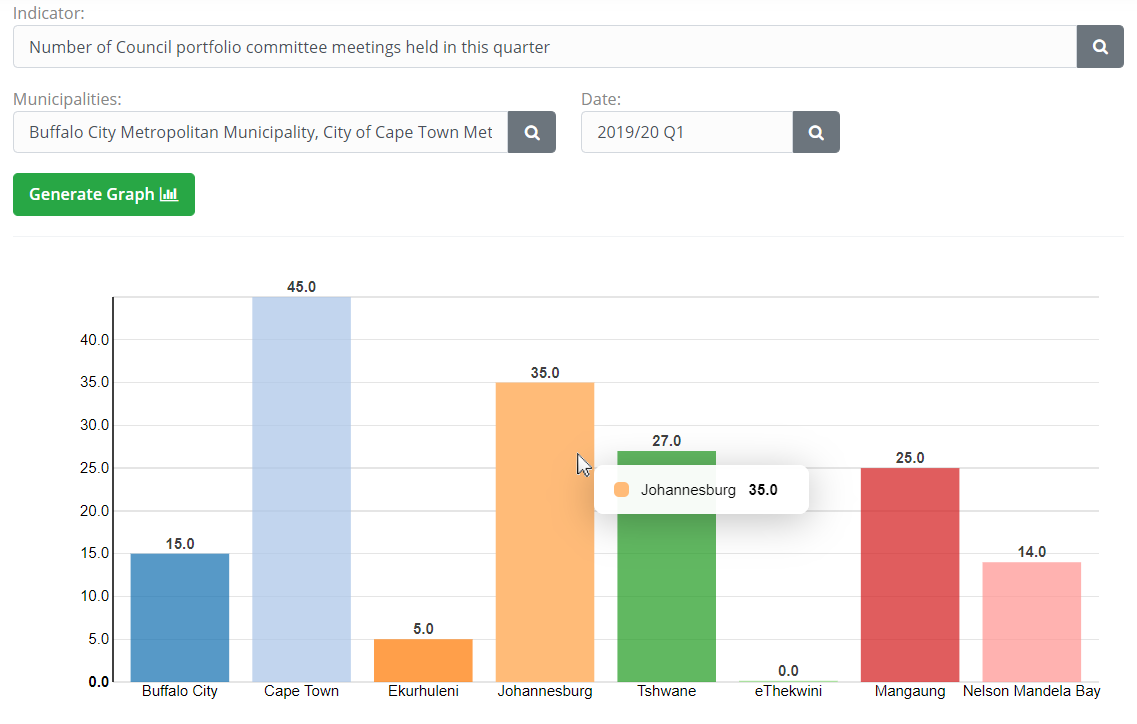
Adding custom charts and graphs is relatively quick and easy, so our approach is typically to build the visualisations that client requires.
Reportal Customisations
There are no real limits to the customisations that can be done in Reportal. Below we list a few that we have developed to give you an idea of the possibilities, and also to highlight some of the functionality that can easily be brought in and adapted from these other Reportal implementations.
GIS Functionality (GIS)
When “GIS functionality” is a requirement in the M&E space, it typically means the ability to visualise data (the indicators) on a map – i.e. creating choropleth maps. Occasionally it can mean more advanced GIS functionality, such as geocoding or processing of shape file data. Both of these options are a possibility in Reportal, as the system is built using SQL Server which has pretty powerful spatial data functionality – see: https://docs.microsoft.com/en-us/sql/relational-databases/spatial/spatial-data-sql-server?view=sql-server-ver15.
The image below shows an example of viewing data on a map using Google Maps. The functionality was developed at the start of the COVID-19 outbreak, to produce an assessment of vulnerability (using a multi-criteria analysis) in the Western Cape, and to represent the results visually on a map.
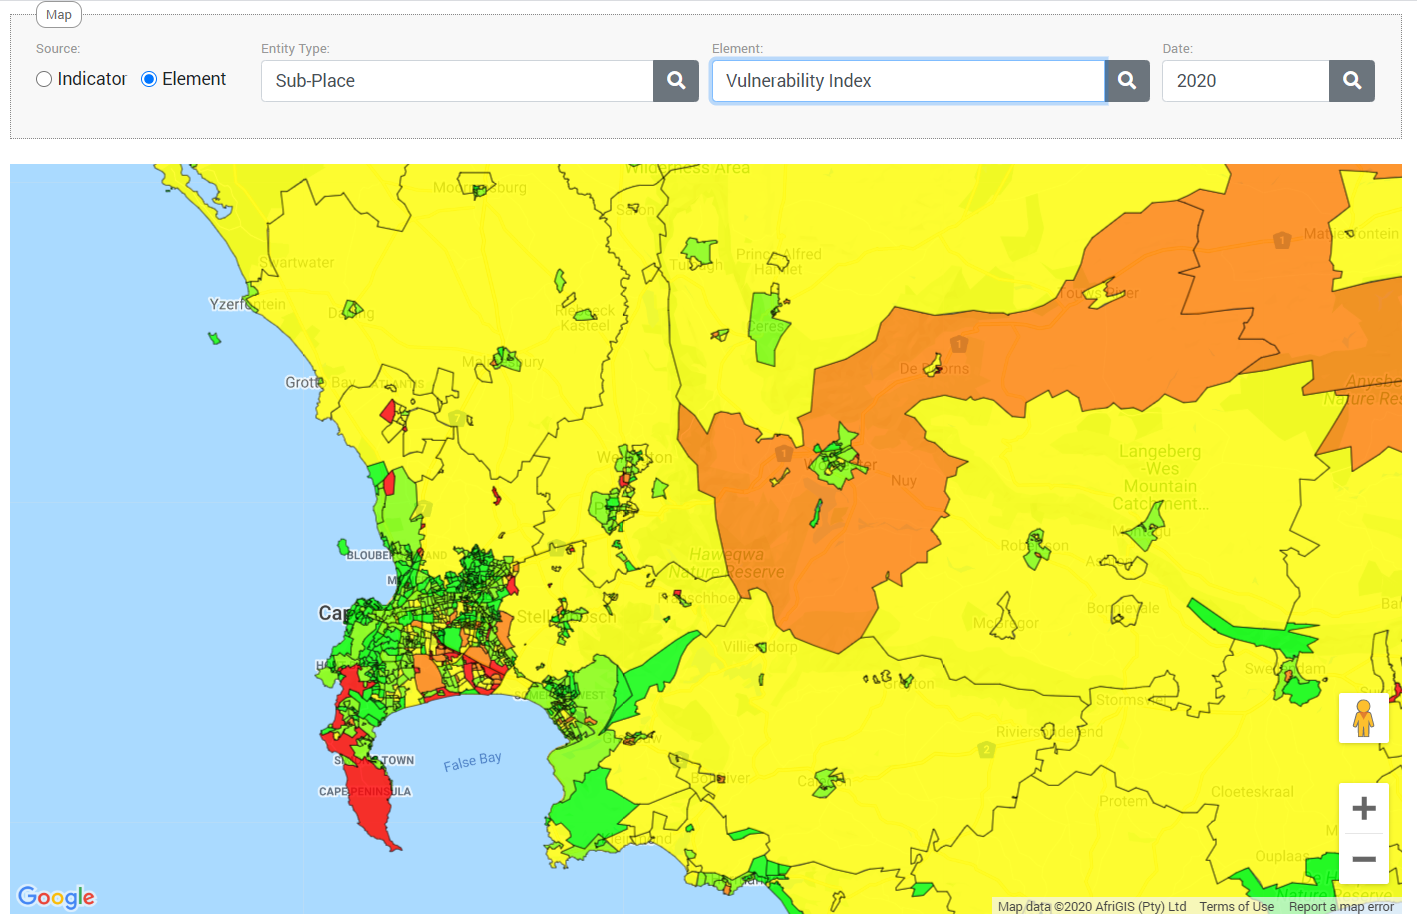
This functionality simply requires linking the results via the entity code to a region or shape in a GeoJSON file, which itself can be easily produced from a GIS shape file.
We can also utilise the spatial tools in SQL Server to perform more advanced GIS functionality, such as intersection (overlap) queries, locating coordinates in areas, reverse geocoding addresses, etc.
Multi-Criteria Analysis
The above Vulnerability Index data was calculated using a multi-criteria analysis (MCA) tool built into Reportal. The MCA tool lets you define a number of groups (in this example: Exposure Risk, Transmission Risk, Socio-Economic Risk and Susceptibility Risk), with weights, as shown below
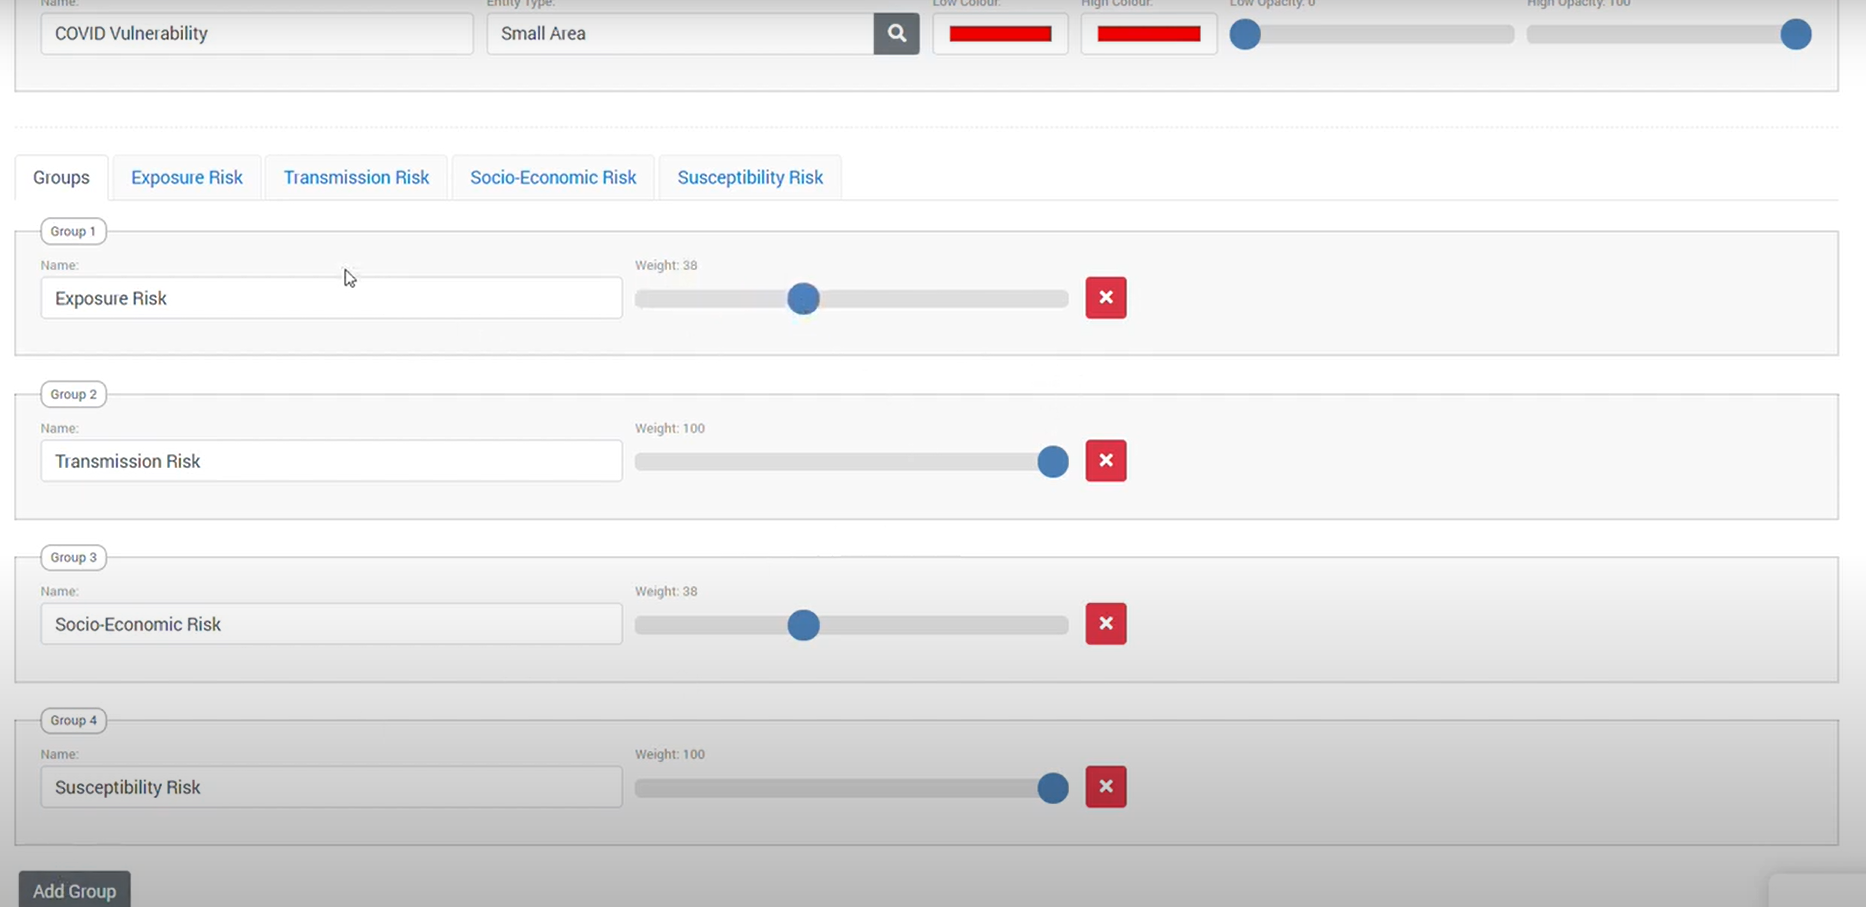
For each group you can then specify one or more elements or indicators, with their own weightings. In the example below, the Transmission Risk group is made up of the indicators for Population Density (people per square kilometre) and Average Household Size. The MCA tool will then score each region according to those criteria, making the results available to the Reportal mapping feature.
A short video on the MCA functionality is available at: https://youtu.be/Qjp9Z1_8Xpc
Custom Data Entry Forms
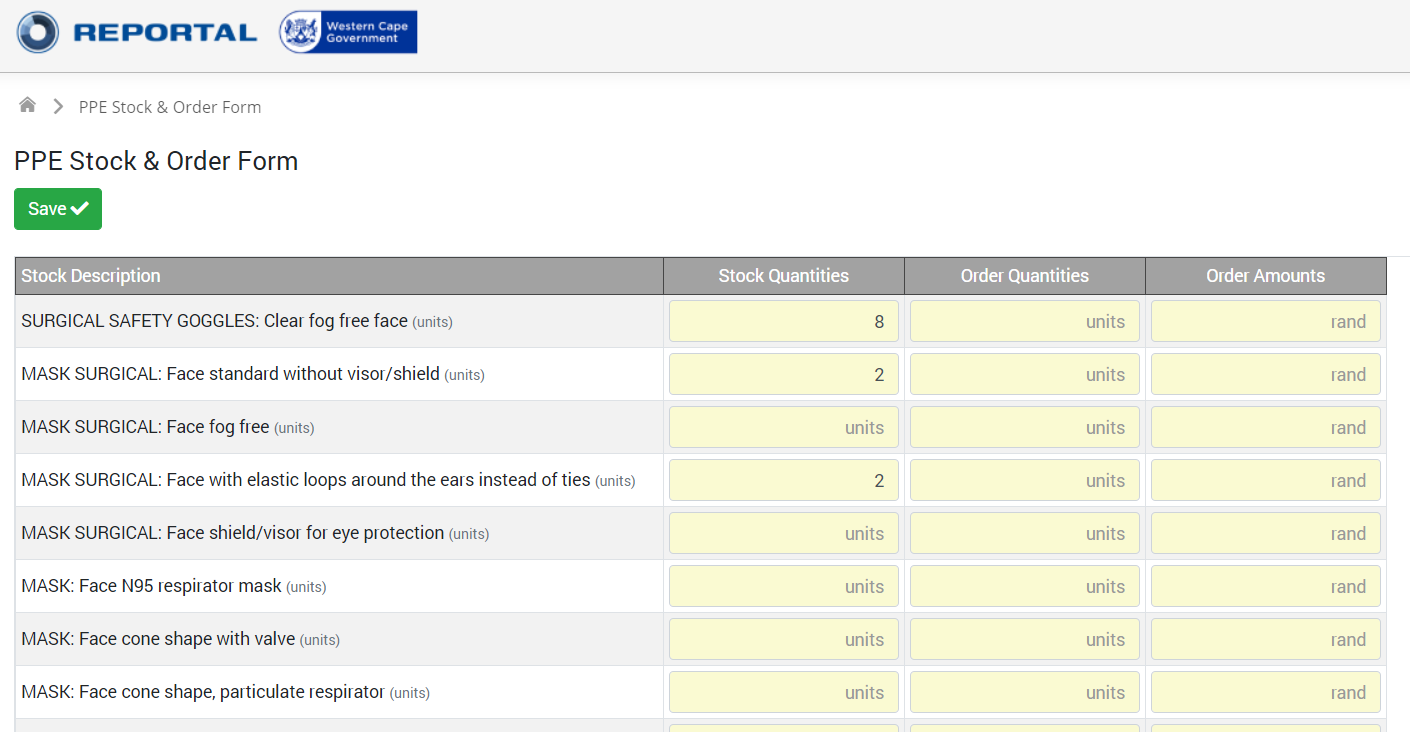
We mentioned earlier how additional ‘schedules’ were developed for the RURA implementation, which allowed the capturing of non-element data forms. Another customisation was to develop a PPE Stock & Order form for the capturing of PPE requirements during the COVID crisis. The screenshot below shows how a custom form was built for the daily capturing of PPE information at hospitals and clinics. While this information fed into the data element store, it also had the ability to carry-over information from one day to the next, until it was subsequently modified by a user.
A short video of this PPE functionality is available at: https://youtu.be/wSoLrxMwT04
The IBER (National Treasury) implementation has its own custom form, which replicates the Excel template in a webpage. This form lets the user capture data for multiple items (baselines, targets, expenditure values, and comments) in a single row, as well as capturing both indicator- and element-related fields.
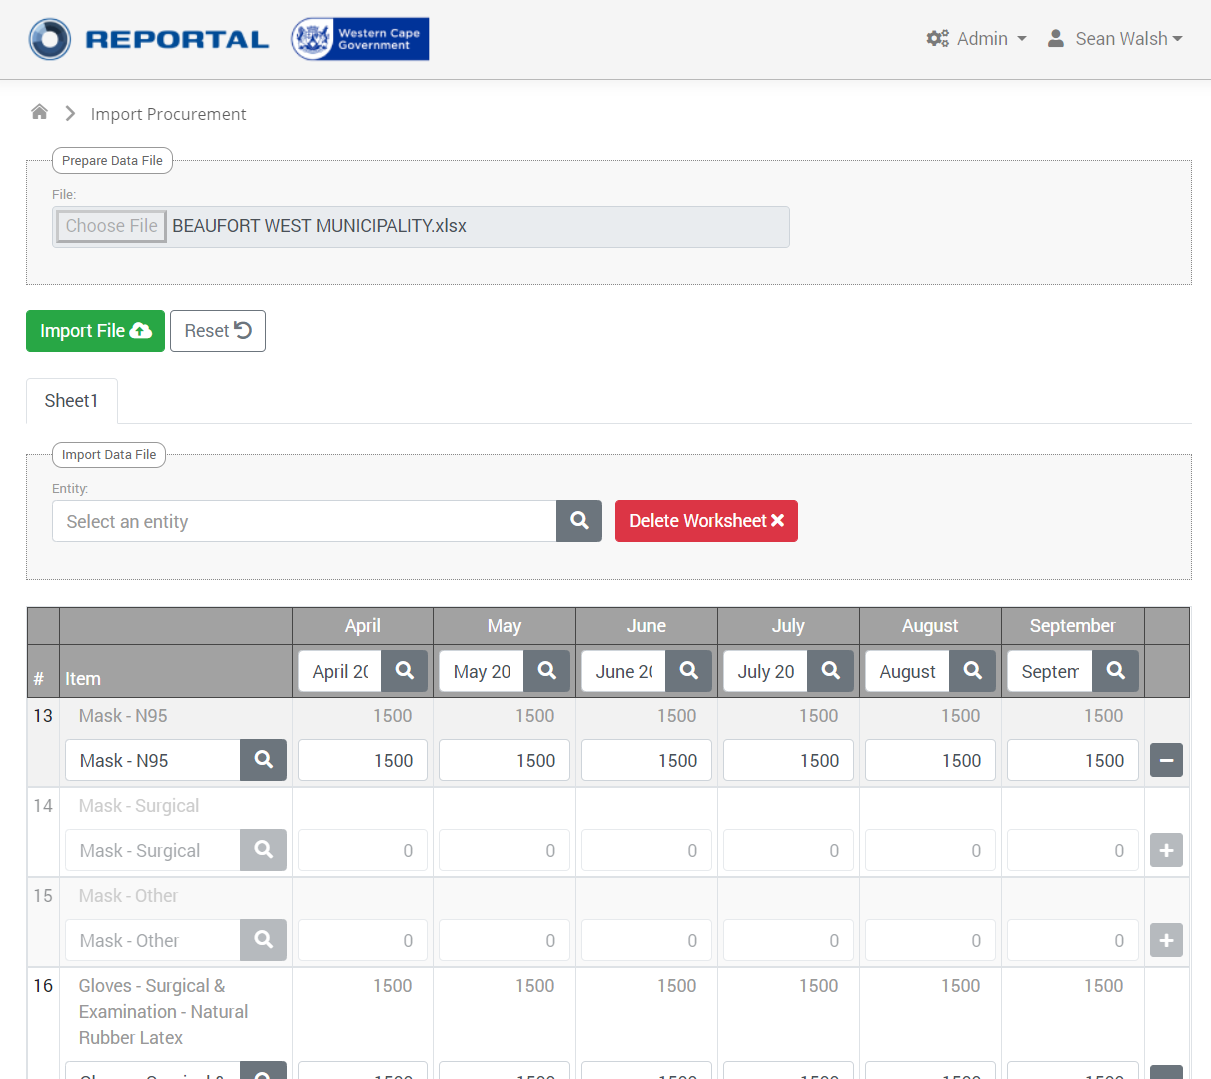
Reportal can also be customised to handle very specific file imports. The screenshot below shows shows an import process that was developed to process an Excel template that was circulated by the Office of the Chief Procurement Officer (OCPO), in order to collate the PPE requirements from different provincial departments, for the subsequent six month period.
Whereas this was a manual process of consolidating dozens of spreadsheets and then using manual Excel-based formulae to calculate the totals, we automated the import of the templates in Reportal, and relied on the built-in aggregation functionality to produce the results at provincial and departmental levels.
It is interesting to note where the terms of reference mentions having a “uniform electronic monitoring system”: this was precisely the challenge facing the OCPO – as users adjusted the Excel templates, it created difficulty for the OCPO to collate them. Our preferred approach would be to use the web-based data entry forms, which provides a much more robust and standardised form, with richer validation features. Furthermore, as departments modified the actual element names in Excel (adding “Box of 50” or “box of 100”) – the ability to have standardized elements for comparison across municipalities was compromised. Reportal’s web-based interface acts as a Quality Assurance Mechanism, preventing data entry unless it passes the validation requirements.